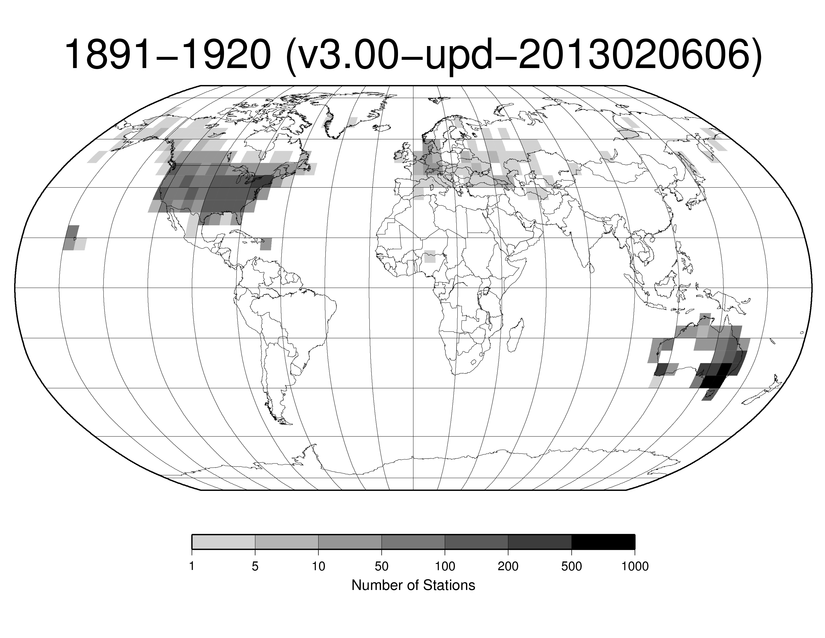
If they missed this, this puts into question all the rest of the data IMO.
"For the years leading up to 1850 we use PAGES2k Consortium reconstruction data. It is based on models where temperatures are reconstructed from proxies. Proxy analysis has higher uncertainty, and we display the smoothed set to highlight the longer-term fluctuations."
It would be in there, but smoothed over instead of the year-by-year entries that you are looking for.
For a lot of datasets like this that are before modern monitoring programs, you can often tell when something "big" happened in a certain time period or year from another source, but then you have to decide how to incorporate that with your long-range data that doesn't have year-by-year values. Sometimes it's best to just choose one method that covers all of the years and stick with it instead of modifying your model based on what you "think" is right from other sources.
Say you have n continuous parameters to your mode. This equates to an n dimensional polygon. Unless you a high iteration Monte Carlo technique the output of your model is going to depend on where exactly your estimator point in n degree space lands, and its accuracy will depend on its distance from the actual (unknown) point in the set.
Now, many of the parameters in large models have never been measured. They are averages from the literature, or in cases where there is no literature, which is common in cutting edge science, the investigators guess.
If you look at the meta studies of climate models, which is what the IPCC uses to make projections, they come out all over the place. These models really aren't great prediction tools. They are best thought of as tools for understanding a the components of a complex system.
Covid was a perfect example: modeling was suggesting devastating impacts from covid, to which localities responded differently, some were aggressive, some were lax. It didn't seem to matter. Yes, one can find statistically significant instances where different covid responses led to higher mortality rates, but nothing substantial enough for any group to want to change what they did.
CO2 makes up 0.04% of the atmosphere and humanity is only responsible for 3% of its creation. We are making very fine grained estimated using a macro model. It's a bit like carving toothpicks with a chain saw.
PAGES2K has no credibility unfortunately. If the proxies worked they could just use them for the modern era too and avoid the splicing, with thermometer readings providing only greater detail (which isn't important anyway because climate change is about long term trends).
They don't do this. The main reason is because the proxies fail totally in the modern era, with the computed temperatures being very different to observations. The correct interpretation of this is that the chosen proxies don't work for any era, but what they do instead is sweep this fact under the carpet by replacing modern proxy reconstructions with measurements so you can't spot the divergence.
The proxy timeseries also frequently contradict each other in magnitude and direction. For example many proxies show no change over time. If these were truly proxies for global or regional temperature as claimed then different proxies would agree with each other.
If you look at how PAGES2K was constructed it is a festival of pseudo-science. All the usual tricks are there. They delete or truncate data they don't like. What datasets they include varies wildly from release to release without justification. They include tree proxies that they know are distorted by increased CO2=greening in the modern era, and then claim it's a proxy for temperature (this is how Mann got his hockey stick graph in the early 2000s). They even flipped one proxy upside down, the correct interpretation was that temperature had fallen sharply at that location but because they already know what they expect to see, this was mistakenly interpreted backwards and turned into evidence of warming (see the dispute over the varve cores from Hvitavatn in Iceland).
Proxy reconstructions of the past are unfortunately quite a mess.
That 3% extra per year is enough to tip the scales so that net CO2 in the atmosphere has been growing (don’t need a model for that, it can be directly measured).
For details see the recent little book The Physics of Climate Change.
What explains the remaining percent points then?
Atmospheric CO2 at the first measurement in ~1958 was ~318, latest in 2022 was ~419 (reading a plot on wikipedia[1]). Note that in 1958, the industrial revolution was already in history books, idk what pre-fossil-fuel values were. Going from 318 in 1958 to 419 in 2022 is +32%, you said 3%, so there's a few missing there
[1] https://en.wikipedia.org/wiki/Carbon_dioxide_in_Earth%27s_at...
Edit: just noticed the article lede says +50% since mid-18th century, I don't need to be interpreting graphs here lol. Either way, you missed an order of magnitude somewhere. But it also doesn't matter, because if 3% would have changed our habitat then it still would have been too much right?
3% per year would be dangerous: in the 60s it used to be 320 out of a million molecules of air, 320*(1.03^(2023-1960)) = 2060 per million. A cognitive decline is observable as of 1000 per million. https://en.wikipedia.org/wiki/Carbon_dioxide#Below_1%
Don't underestimate compound interest across multiple generations!
Also bear in mind that data from ~1850 to 1950 is extremely sparse for most of the Earth's surface. Other than the USA very few places had widespread thermometer readings recorded during that era. For example the southern hemisphere outside of coastal Australia has almost no data. The error bars are also very wide, climatologists make big adjustments to the older data because they think the thermometers weren't being read correctly.
The climate is millions of years old. We have at best 200 years of data.
If we are wrong about this Putin wins big time as Russia is sticking to its fossil fuel revenue sources and keeping the majority of the developing world on fossils.
Russia is turning Africa as we speak. Do you have any idea of what the implications are of Russia achieving global dominance, in alliance with China?
Did you forget about Europe, and the measurements that also took place in the empires of Europe?
Russia also has some pretty detailed records from across the span of what was their empire.
I'm not sure about Asia, but as I said the records from victorian period are pretty good in India and nearby countrys.
I'd been interested to learn more about your statement there, as it doesn't match with my own reading.
I'm not sure what conversation we're having if you start a new topic without replying to the old, but sure I'll humor you on those points as well
> The climate is millions of years old.
At best, it's a few thousand years old. The climate was quite different 20k years ago during the last glacial period.
> We have at best 200 years of data.
Why are you're ignoring ice cores and other things we've drilled up and measured?
> Putin wins big time
Okay. I really don't care that one human, who will be long dead by then, turns out to have been right that climate change is a hoax, though I'm not aware that he made any statements on the matter. I'd be really happy if we're all wrong and the last dozen summers were just coincidentally hot and everything goes back to normal of its own accord. Better that and a rich Russia than the world being too warm for most of today's animals and sad Russians to boot!
Looking into this now, though, the linked website has a emissions page[1] which shows only an absolute number rather than a year-on-year increase. Where did you find the YoY value of ~3%?
[1] https://climatechangetracker.org/co2/human-induced-yearly-co...
https://www.ncei.noaa.gov/sites/default/files/2021-03/statio...
Notice how the data comes almost entirely from the USA and Australia. In Australia it's only the populated coastal regions with data, with the central deserts having none. Density in Europe is virtually non-existent by comparison, with Spain/Portugal having no data, most of Russia having no data, large parts of Europe having only a single station, there's nothing in China, India, Japan, there's a single station for the whole of Africa, etc. And of course the sea is missing.
By 1950 things have improved in the northern hemisphere somewhat:
https://www.ncei.noaa.gov/sites/default/files/2021-03/statio...
Russia and Europe now has coverage throughout, albeit with way lower station density than the USA (probably it doesn't matter much). The southern hemisphere outside of Australia is still almost completely missing, just a handful of stations outside of South Africa.
Even today most parts of the Earth's surface are missing direct land measurements (there are satellites):
https://climatedataguide.ucar.edu/sites/default/files/2022-0...
None of this is surprising. Only rich stable parts of the world can afford to spend time reliably reading thermometers every day. Europe spent a lot of the time before 1950 either at war or rebuilding.
Note that missing data doesn't stop them colouring in those parts of the map with temperature readings and claiming they come from ground stations. They don't make it clear but for most of the world temperature readings are made up (interpolated over vast distances), example:
http://www.columbia.edu/~mhs119/Temperature/T_moreFigs/2015-...
They don't know what the mean was in 1950 for most of the world because they don't have any data, but that doesn't stop them drawing maps showing the change from that non-existent mean.
Once those markets have functioning solar/renewable industries of their own they will need less and less fossil fuel.